Most hiring teams have plenty of recruitment data: applications, interviews, offers and hires. Few turn it into decisions. Recruitment analytics closes that gap. It shows where good candidates come from, where they drop out, and what slows your team down. This guide explains what recruitment analytics is, the four levels of analytics, the 12 recruitment metrics every HR team should track, how to build a recruitment dashboard, and which tools support custom funnel stages.
What Is Recruitment Analytics?
Recruitment analytics is the practice of collecting and analysing hiring data to make better recruiting decisions. It turns everyday activity, such as job posts, applications, interview stages and offers, into recruitment metrics like time to fill, source of hire and offer acceptance rate.
It is sometimes called hiring analytics or talent acquisition analytics. Whatever the name, the goal is the same: replace gut feeling with evidence about what works in your hiring process.
Why Recruitment Analytics Matters for Modern Businesses
- Faster hiring: you can see which stage holds candidates up and fix it.
- Lower cost per hire: you can spend on the job boards and sources that actually produce hires.
- Better hires: you can connect sources and interview steps to how new employees perform.
- Fairer decisions: structured data makes it easier to spot inconsistent interviewing.
- Credibility with leadership: you can answer "when will this role be filled?" with data, not guesses.
Four Levels of Recruitment Analytics
Recruitment analytics usually grows through four levels. Most teams start at the first and add the others as their data improves.
Operational analytics
What is happening now? Open jobs, applicants per job, candidates in each stage and interviews scheduled this week. This is the day-to-day view recruiters use.
Efficiency analytics
How fast and how cheaply are you hiring? Time to fill, time to hire, time in stage and cost per hire. This level shows where the process is slow or expensive.
Quality analytics
Are you hiring the right people? Quality of hire, 90-day retention, hiring manager satisfaction and offer acceptance rate. This level connects recruiting to business results.
Predictive analytics
What is likely to happen next? Forecasts such as how long a new role will take to fill, or how many applicants you need for one hire, based on past data. This level needs a year or more of consistent data.
12 Important Recruitment Metrics Every HR Team Should Track
| # | Metric | What it measures | How to calculate it |
|---|---|---|---|
| 1 | Time to fill | Days a vacancy stays open | Offer accepted date − requisition approved date |
| 2 | Time to hire | Days from candidate engagement to acceptance | Offer accepted date − date candidate entered pipeline |
| 3 | Cost per hire | Average cost of hiring one employee | (Internal + external recruiting costs) ÷ number of hires |
| 4 | Application conversion rate | Share of careers page or job ad visitors who apply | Applications ÷ job page visitors × 100 |
| 5 | Interview-to-offer ratio | How many interviews it takes to make one offer | Candidates interviewed ÷ offers made |
| 6 | Offer acceptance rate | Share of offers accepted | Offers accepted ÷ offers made × 100 |
| 7 | Candidate drop-off rate | Candidates who leave the process at each stage | Candidates who withdraw or go silent at a stage ÷ candidates who entered it × 100 |
| 8 | Source of hire | Which channels produce hires | Hires from each source ÷ total hires × 100 |
| 9 | Quality of hire | Performance and fit of new hires | Average of agreed measures, such as performance rating, hiring manager score and 90-day retention |
| 10 | Hiring manager satisfaction | How satisfied hiring managers are with the process and candidates | Average score from a short survey after each hire |
| 11 | Recruitment funnel conversion | Movement between stages | Candidates reaching the next stage ÷ candidates in the current stage × 100 |
| 12 | Requisition fulfilment rate | Share of approved vacancies filled | Roles filled ÷ roles approved in the period × 100 |
For formulas and worked examples of the first two, see our guide to. See time to fill vs time to hire.
A few practical notes:
- Cost per hire should include internal costs (recruiter time, ATS subscription) and external costs (job board ads, agency fees, assessments).
- Source of hire is only accurate if every application is tagged with its source automatically.
- Quality of hire needs agreement with hiring managers on what "good" means before you measure it.
- Drop-off rate is most useful by stage: a high drop-off after the first interview points to a very different problem than a high drop-off after the offer.
How to Build a Recruitment Analytics Dashboard
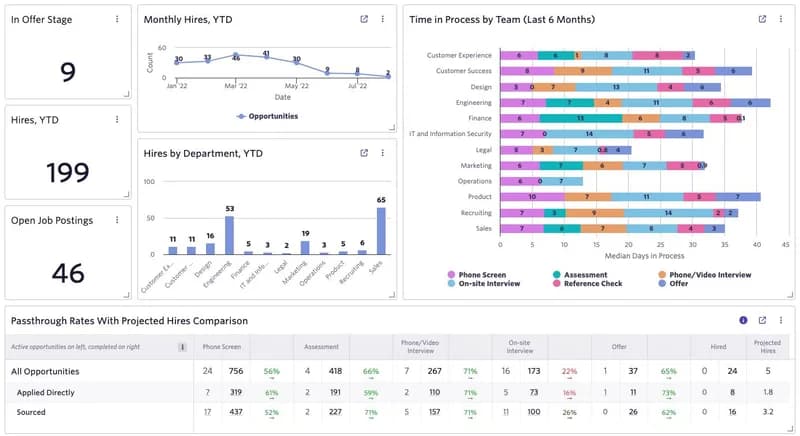
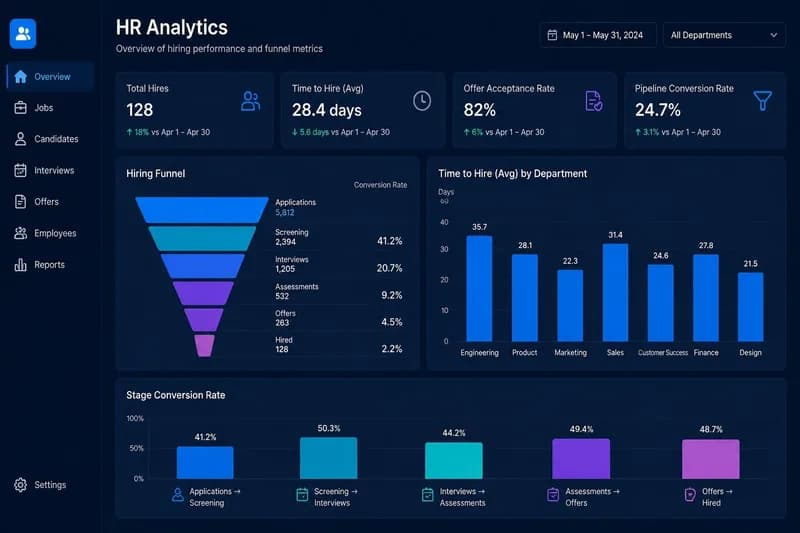
A good recruitment dashboard answers three questions at a glance: where every candidate stands, what needs action today, and how the hiring funnel is performing.
- 1Pick 5 to 7 metrics. Start with time to fill, time to hire, offer acceptance rate, source of hire and funnel conversion. Add more later.
- 2Agree on definitions. Write down when each clock starts and stops, so every report uses the same rules.
- 3Use your ATS as the data source. Stage changes, dates and sources should be recorded automatically, not typed into a spreadsheet.
- 4Add filters. Let users filter by job, department, location, recruiter, source and date range.
- 5Show trends, not just totals. A line showing time to fill by month tells you more than a single average.
- 6Set targets. Show each metric against an agreed goal, such as offer acceptance above 80 percent.
- 7Schedule a review. Send the dashboard to hiring leaders weekly and review it together monthly.
How to Measure Hiring Funnel Performance
Your hiring funnel is the set of stages a candidate moves through, for example Applied, Screened, Interviewed, Offered and Hired. To measure it:
- 1Count candidates entering each stage for a job or a period.
- 2Calculate stage-to-stage conversion, for example Screened ÷ Applied.
- 3Measure time in stage for each step.
- 4Compare by source and role. A source with many applicants but low screening conversion is costing you recruiter time.
What recruitment analytics tools support custom funnel stages? Most modern ATS platforms let you define your own pipeline stages per job, and the better ones report conversion and time in stage for those custom stages, not just default ones. When you evaluate tools, check that custom stages appear in reports, that you can compare stages across jobs, and that historical data is kept when stages change. In OneATS you can customise your hiring pipeline stages, set a time limit for each stage and see days in stage on every card.
Recruitment Analytics for Different Hiring Models
IT recruitment
Track time to fill by skill, offer acceptance rate, and drop-off during notice periods. In India, add offer-to-join time and the share of accepted offers that never join, because 60 to 90 day notice periods leave room for counter-offers.
Sales recruitment
Track source of hire, interview-to-offer ratio and quality of hire, measured as quota attainment after six months. Sales roles often have high volume, so screening conversion matters.
Campus recruitment
Track applications per college, test and interview pass rates, offer acceptance and joining rate. Compare colleges by hires and by performance after one year.
Recruitment agencies
Track submissions per consultant, submission-to-interview and interview-to-placement rates, placements and revenue by client, and time to submit. See staffing agency ATS.
Common Recruitment Analytics Mistakes
- Inconsistent definitions, such as starting time to fill at different points for different teams.
- Manual data entry, which leads to missing dates and untrusted reports.
- Too many metrics, so nobody knows which ones matter.
- Averages without context. One very slow senior hire can distort a team's average; look at the median too.
- Ignoring source tagging, which makes source of hire data meaningless.
- Measuring speed but not quality, which rewards fast hiring of the wrong people.
How ATS Software Improves Recruitment Analytics
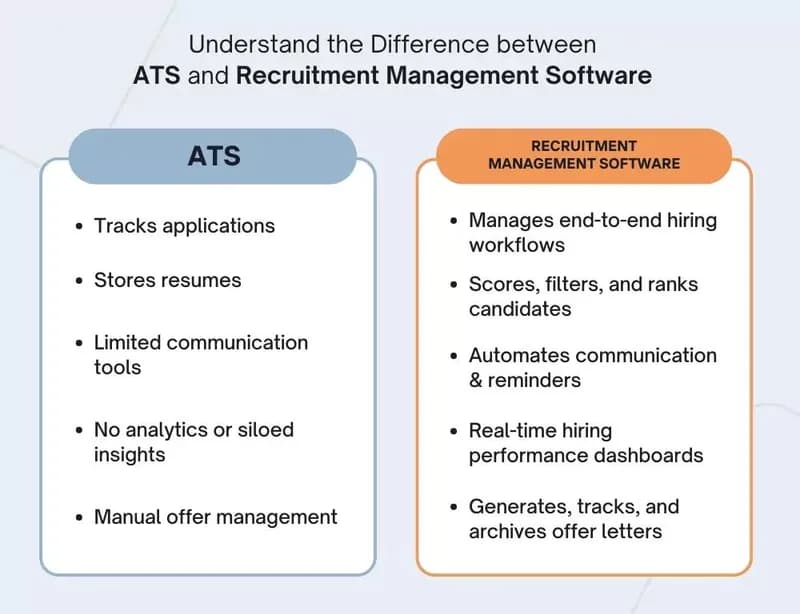
An applicant tracking system is the most reliable source of recruitment data, because it records every application, stage change and offer automatically, with a date and a source. That means your metrics are complete and consistent without manual work.
Which ATS tools offer analytics on hiring pipeline and time-to-fill? Look for an ATS that calculates time to fill and time to hire automatically, reports conversion and time in each custom stage, tracks source of hire, lets you filter by job, team and recruiter, and exports or schedules reports. OneATS covers time to fill, time to hire, funnel conversion and source of hire, with CSV and Excel exports and scheduled reports on the Business plan, so you can see your hiring funnel without building spreadsheets. See ATS analytics.
Frequently Asked Questions
What is recruitment analytics?▼
Recruitment analytics is the collection and analysis of hiring data, such as applications, stages, offers and hires, to improve recruiting decisions. It turns activity into metrics like time to fill, source of hire and offer acceptance rate.
What are the most important recruitment metrics?▼
Start with time to fill, time to hire, cost per hire, offer acceptance rate, source of hire and funnel conversion. Add quality of hire and hiring manager satisfaction once the basics are reliable.
What should a recruitment dashboard include?▼
Open roles, candidates by stage, time to fill and time to hire trends, offer acceptance rate, source of hire and funnel conversion, with filters for job, team, recruiter and date.
What recruitment analytics tools support custom funnel stages?▼
Most modern ATS platforms let you create custom pipeline stages. Choose one that reports conversion and time in stage for your custom stages, compares them across jobs, and keeps history when stages change.
Conclusion
Recruitment analytics doesn't need a data team. Pick a handful of recruitment metrics, define them clearly, let your ATS collect the data, and review a simple dashboard every month.
Editorial Integrity & Sourcing: All articles are authored and verified by our recruitment operations and engineering team, vetted against primary regulatory documentation (such as India's DPDP Act, 2023 and EPFO/ESIC guidelines) and direct job portal APIs before publication.

Pankaj Mukadam is the Head of Product at OneATS. With deep expertise in talent acquisition infrastructure and recruitment operations, he leads product architecture and hiring workflows at OneATS, helping companies streamline recruitment across India and globally.